Preliminary Results from the Eclipse Soundscapes Project
by Kelsey Perrett and MaryKay Severino
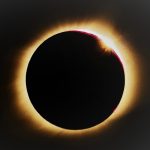
Do birds sing during a solar eclipse? One year after the Great American Eclipse of 2024, we’re learning how avian species responded to this inspiring celestial event.
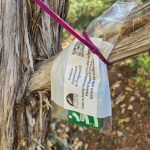
As one facet of the Eclipse Soundscapes Project, 1310 people began the process to be ES Data Collectors and almost 500 Data Collectors used AudioMoth recording devices to capture soundscapes before, during, and after the April 8, 2024 solar eclipse. The aim was to establish a baseline for “normal” soundscape activity on non-eclipse days and determine whether those soundscapes were altered by the total solar eclipse, in which the Moon passes in front of the Sun, temporarily blocking its rays. 45,960 total hours of audio were captured (if a human were to listen to the recordings for 8 hours a day, it would take 16 years to complete!) Over the past year, the Eclipse Soundscapes team has worked tirelessly to organize this gigantic collection of audio data. Now, with the help of wildlife biologist Dr. Brent Pease and the machine learning technology of BirdNET, Eclipse Soundscapes has uncovered some exciting patterns in the data that indicate how bird species reacted to the eclipse.
The map shows the locations where audio data for the 2024 Eclipse Soundscapes project was recorded and shared with the ES team. The map also illustrates the eclipse path. If the map does not load, or to open it in a separate tab, click here.
Historical accounts of bird vocalizations
Eclipse Soundscapes was based on an early participatory science initiative from the 1930s. For the August 31, 1932 total solar eclipse, the Boston Society of Natural History invited the general public to submit written observations of any animal behaviors they noticed during the eclipse. Many of these anecdotal reports suggested that animals — including birds — changed their vocal activity as the sky darkened. “It was noticeable that as the eclipse progressed, there was a decrease in the chorus, with a silence during totality,” wrote one participant. Other participants noted an increase in bird activity — the society received “several reports of hooting from wilder sections in New Hampshire.”

Establishing a baseline for bird vocalization
Interestingly, the preliminary findings from Dr. Pease and the team mirror the anecdotal reports presented by the Boston Society of Natural History. The Eclipse Soundscapes Project ran its 2024 audio data through BirdNET, a machine-learning tool that identifies bird species from sound recordings. Because Eclipse Soundscapes Data Collectors recorded for two days prior to the eclipse and for two days after the eclipse as baseline data, the researchers were able to estimate the probability of vocalization during a 4-minute window at the specific time of day when totality occurred. (Totality occurs when 100% of the Sun is blocked by the Moon). They then used that data to investigate the question of whether bird vocalization patterns change during a solar eclipse.
Do bird vocalization patterns change during an eclipse?
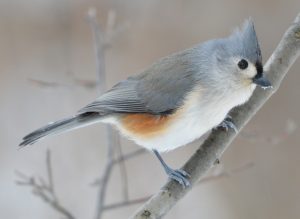
The initial data showed varied results. Some bird vocalizations increased during totality, while others decreased. However, when the researchers broke the vocalization down by species and by family, patterns began to emerge. Birds like the Tufted Titmouse showed a marked decline in vocalization during totality (a 5% decrease in the probability of vocalizing compared to the same 4-minute time period on non-eclipse days).
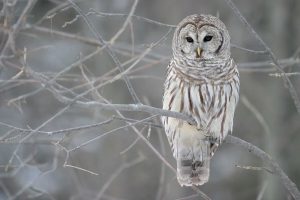
On the other hand, Barred Owls increased vocalization during totality (a 4% increase in vocalization probability).
Although researchers have audio data from the eclipse day, they used probability of vocalizing to compare that behavior to a typical day at the same time and location. This approach helps account for natural daily rhythms (some species are more or less active at certain times) and provides a clearer picture of how eclipse conditions altered usual behavior. A negative change means the species was less likely to vocalize during the eclipse than expected, while a positive change indicates an increase beyond typical levels.
The trends remain when looking at bird families. Ichteridae and Paridae (including titmice) consistently showed decreased vocalizations, while Corvidae and Strigidae (including owls) consistently showed increased vocalizations. This variation may be explained by species’ sensitivity to light. Nocturnal species and those that typically vocalize at dusk, such as robins, appeared to respond to the eclipse with increased vocal activity, suggesting a response to the sudden dimming of light or heightened sensitivity to light cues.
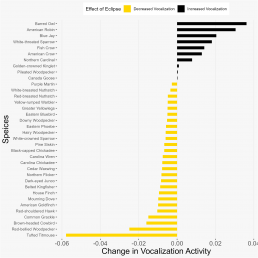
This bar graph shows how the probability of vocalization on solar eclipse day by bird species. It uses audio data collected during the week of the April 8, 2024 total solar eclipse. The graph lists bird species on the left side and shows whether each became more or less vocal during the eclipse. Yellow bars pointing to the left show birds that were quieter than usual, while black bars pointing to the right show birds that were more vocal. Birds that increased their vocalizations include the Barred Owl, American Robin, Blue Jay, White-throated Sparrow, Fish Crow, and American Crow. Birds that became quieter include the Tufted Titmouse, Red-bellied Woodpecker, Brown-headed Cowbird, Common Grackle, and Red-shouldered Hawk. The biggest decrease in vocal activity came from the Tufted Titmouse, while the Barred Owl showed the largest increase.
Timing of the behavioral response
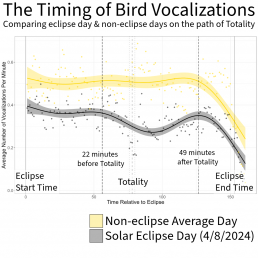
With these special and familial patterns in mind, the researchers could then explore the timing of the behavioral response: At which point before or during totality did vocalization changes start? And how long do those changes last? The team charted the average number of bird vocalizations per minute across time, for both a “random day” before/after the eclipse, and on the day of the eclipse. The graphs showed that decreased vocalization began trending downward about 22 minutes prior to totality, and returned to normal approximately 49 minutes after totality.
For all other periods on the day of the eclipse, vocalizations per minute roughly matched the trajectory of the random days. Recordings taken outside the path of totality also roughly matched the trajectory of the random days, and are not included in the graph below. This indicates that the changes in vocalizations per minute were unique to the path of totality on the day of the eclipse.
While these findings are currently more about gaining baseline knowledge, they raise interesting questions about how birds respond to sudden changes in light. Could similar patterns emerge during other abrupt natural events, like thunderstorms or wildfires? Understanding these responses might eventually help researchers distinguish between different types of environmental disruptions, offering new ways to monitor ecosystem health through sound.
What’s next?
“It’s still early stages,” Dr. Pease said about these preliminary results. “We’re starting to see some really interesting and fun things. But there are lots more questions and more analysis to do.” Dr. Brent Pease, a Soundscapes Subject Matter Expert, is leading research efforts to analyze eclipse-related audio data collected by ES volunteers. His work focuses on understanding how wildlife responds to eclipses through changes in natural soundscapes.
A few questions Dr. Pease would like to explore include:
- Proximity to totality: How close to totality do birds need to be to produce these changes? Location data tied to the audio recordings will help Eclipse Soundscapes answer this question.
- The “dawn chorus reprise:” Dr. Pease notes a slight bump in the graph after totality in which birds vocalization increased. A closer look at which birds are making these vocalizations will help researchers determine if it does in fact mimic dawn-like activity.
- Non-bird responses: Do other species (like insects) change their vocalizations during the eclipse?
- 2023 Annular Eclipse vs. 2024 Total Solar Eclipse – Soundscapes Audio Data: Does the bird response along the path of annularity during the 2023 annular eclipse (with approximately 90% coverage) match the response just outside the path of totality during the 2024 total solar eclipse, where coverage was also around 90%?
While researchers are only beginning to scratch the surface of these questions, the collected audio data for the project will be uploaded to the Eclipse Soundscapes Community on Zenodo, a free, open-access repository before the project ends. Present and future researchers will be able to access this audio data to learn more about how eclipses impact soundscapes on Earth and other questions. The Eclipse Soundscapes team looks forward to learning more about the data collected by our fantastic Eclipse Soundscapes volunteers!
To learn more about the preliminary results, watch or listen to Dr. Pease’s presentation “Eclipse Soundscapes: Partnering with the Public to Illuminate the Effect of Eclipses on Wildlife” or join us for a webinar. To learn what webinars are coming up, visit the ES Learning Community page.
References
Wheeler, William Morton . et al. “Observations on the Behavior of Animals during the Total Solar Eclipse of August 31, 1932.” (1935).