Your Donated AudioMoths Are Powering New Science!
Your Donated AudioMoths Are Powering New Science!
Contributing Authors: MaryKay Severino, Vayujeet Gokhale, Rosanne LaBaige, Erin Nichols, Michael Dawson, Matt Barton, Jean Nock, Don Ficken
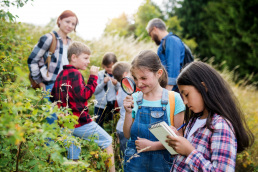
 Eclipse Soundscapes (ES) volunteers continue to make an impact long after the eclipses. Many people chose to donate their AudioMoth devices after submitting their ES data. Because of this generosity, these recorders now have a second life supporting scientific and educational work.
Nineteen donated devices are already in use through a growing collaboration with DarkSky Missouri, a project led by Don Ficken that is working to connect people with the sounds of the night. Scientists, educators, and community leaders are using them to explore and understand the sounds of the night. We first highlighted DarkSky Missouri’s work in an August 2024 post and webinar.
📝 Post: Dark Sky Missouri Uses AudioMoths to Study Nature at Night (August 9, 2024)
▶️ Webinar: Harnessing AudioMoths for Nighttime Nature Conservation (August 21, 2024)
Here’s how the collaboration has grown with the help of donated AudioMoths.
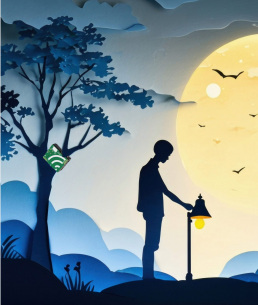
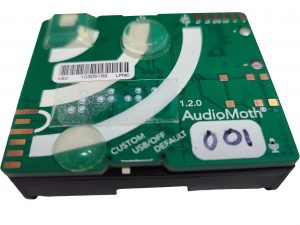
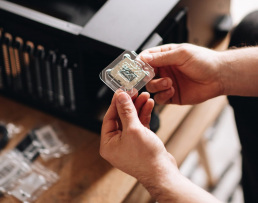
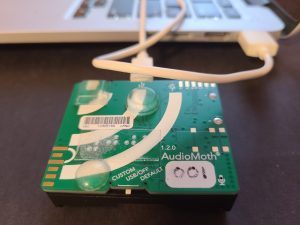
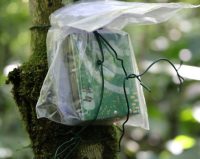
What is an AudioMoth?
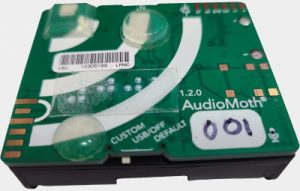
A small, open-source device powered by 3 AA batteries that records environmental sounds, from bird calls and insect activity to human-made noise.
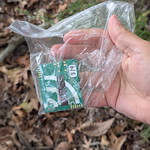
Where to donate my AudioMoth?
DarkSky Missouri c/o Don Ficken
13024 Barrett Crossing CT
St. Louis, MO 63122-4900
Questions? dficken@darkskymissouri.org

Donated Audiomoths are getting a second life at ...
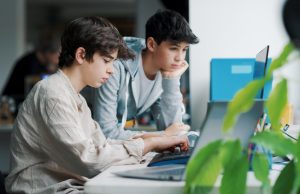
At Truman State University, Dr. Vayujeet Gokhale is incorporating AudioMoths into their Freshman Seminar course “Dark Skies: A Natural Resource.” The course encourages students to appreciate the beauty of the night sky and to develop an appreciation of different life forms active after dark.
Listening to Nature After Dark
As one part of the course, between 8-10 AudioMoths will be installed in and around the main campus and the Truman farm, where the Truman observatory is based, to gather local nature sounds. Three students will monitor and care for each instrument, sharing collected data with the campus DarkSky student group, the Campus Environmental Committee and Student Club.
Connecting Light, Wildlife, and Conservation
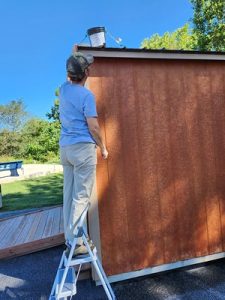
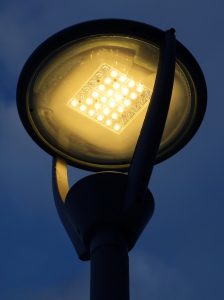 This work also supports ongoing campus efforts to reduce light pollution and protect local wildlife. Truman State is installing fully shielded, dark-sky-friendly outdoor lights with color temperatures below 3000 K, which minimize glare and reduce disruption to nocturnal animals. Learning about which bird species are active on this Audubon-certified Tree Campus will help demonstrate to university stakeholders how these light improvements benefit local wildlife. Check out some Truman lighting pictures here.
Sharing Results with the Community
A short report summarizing the results of these observations will be shared with the Eclipse Soundscapes Community, DarkSky Missouri, and other campuses participating in the Campus SHINE initiative (https://www.campusshine.org/).
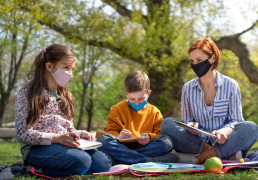
In the Mehlville School District, Library media specialist Erin Nichols is helping students tune into the world around them. Through two new projects that use AudioMoths, students will explore how sound connects to art, music, movement, and the natural environments across their school campuses.
Exploring Sound Through Art, Music, and Movement
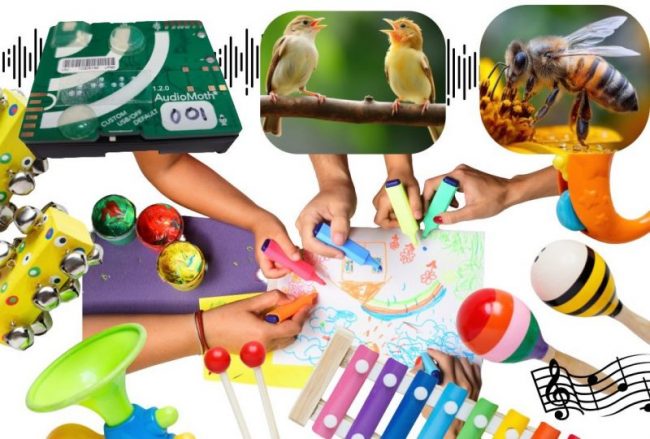 At MOSAIC Elementary, Nichols is collaborating with the art, music, and PE teachers to build upon the first-grade sound unit by incorporating AudioMoths into a new lesson. Students will record sounds in nature and compare them to the tones of musical instruments, the rhythms of PE activities, and the textures of art materials. They will also hypothesize what each sound might look like and express their ideas through original artwork. This creative, cross-disciplinary project helps students explore how sound connects to both the natural world and human activity.
Exploring Biodiversity Across School Campuses
Another project now being planned involves MOSAIC, Bierbaum, and Wohlwend Elementaries to explore biodiversity on each school’s campus. Using AudioMoths to record nature sounds and comparing the amount and quality of green space at each site, students will investigate how natural areas affect local wildlife. This exploration may lead to future opportunities to create more native habitats on school grounds, giving students additional ways to connect with nature and learn about the importance of protecting native species.
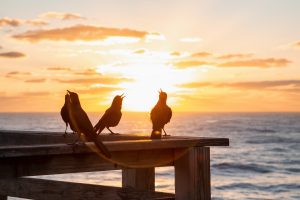
Missouri Master Naturalists will continue their efforts to use AudioMoth devices to monitor nocturnal flight calls and explore nighttime ecology. Volunteers across the St. Louis metro area, including members of DarkSky Missouri, Missouri Master Naturalists, the St. Louis Audubon Society, and the Audubon Center at Riverlands, are deploying AudioMoth devices to capture the faint nocturnal calls of migrating birds each May and September.
Listening to the Night Sky
 In one example, the program recorded flight calls over Gateway Arch National Park, identifying species such as the American Redstart, Least Sandpiper, and Rose-breasted Grosbeak. Missouri Master Naturalists from the Miramiguoa chapter have joined the effort, placing AudioMoths in nature reserves, backyard habitats throughout the metro area, and at a college observatory in southeast Jefferson County.
Connecting Data to Conservation Action
By documenting when birds are overhead, the team aims to raise awareness about the impact of light pollution on migratory pathways. This data supports community collaboration with Lights Out Heartland to encourage lighting practices that protect birds and promote the health of all living things.
 The Saint Louis Zoo is preparing a sound-at-night program and will use donated AudioMoths to replace non-functioning units in their collection.
Supporting the WildCare Spring Peeper Program
The Saint Louis Zoo’s WildCare Spring Peeper Program will use donated AudioMoths to replace non-functioning units in their collection to assist with an ongoing bioacoustics survey of frogs/toads in the Saint Louis Metro Area. The devices will be used to replace non-functioning units to assist with an ongoing bioacoustics survey project titled “Spring Peeper Program: STL-Metro Presence & Absence Survey of non-arboreal Hylidae Species.”
Listening for Frogs after Dark
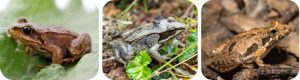
This study will focus on surveying the statistical metro area of Saint Louis for the presence or absence of the following three species: Spring Peepers (Pseudacris crucifer), Boreal Chorus Frogs (Pseudacris maculata), and Cricket Frogs (Acris crepitans blanchardi).
Pay it Forwards - How to Donate Your AudioMoth
If you still have an AudioMoth you’d like to donate for use in education and nighttime science, the DarkSky Missouri team welcomes additional contributions. Send your device to:
DarkSky Missouri
c/o Don Ficken
13024 Barrett Crossing CT
St. Louis, MO 63122-4900
Questions? Reach out to Don at dficken@darkskymissouri.org.
Thank you again to ES volunteer scientists for being a part of Eclipse Soundscapes and for helping scientific exploration continue long after the 2023 and 2024 eclipses.
From Collection to Discovery: Why Processing Takes Time
From Collection to Discovery: Why Processing Takes Time
By MaryKay Severino

If you mailed us a little microSD card for Eclipse Soundscapes, you might be wondering: what happened after it left your hands? Why did processing take over a year? The short answer: scale and complexity.
Think about it.
- Nearly 1,000 AudioMoth devices were registered across both eclipses (219 in 2023 and 770 in 2024).
- Over 600 microSD cards were mailed back (126 in 2023 and 477 in 2024), each with hours of audio.
- Two eclipses happened only about six months apart, which meant we were still receiving and logging 2023 data while also updating protocols, training new volunteers, and preparing free kits for 2024.
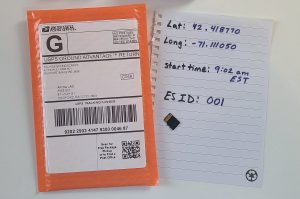
- Some cards came with carefully written notes about time and location, while others had only online notes, only handwritten notes, both, or none at all. That mix made every envelope a surprise, sometimes a complete package and sometimes a puzzle to solve.
When plans met reality
In 2023, things were fairly straightforward on paper. We had not yet invited people to use their own devices, so most returns came in the standardized envelopes we provided, each clearly marked with an ES ID. Even so, sorting took longer than expected. We had originally planned for about 50 sites in 2023 and 200 in 2024, but so many people were excited to join that we expanded both years. That surge meant every microSD card had to be carefully logged by hand, checking whether we had the card itself, the online location info, and any written notes. We worked hard to be transparent by releasing several shared “data dashboard” spreadsheets on the website and posting social media reminders to check them. These updates let participants know what we had on file for them, but the process was still manual work, card by card.
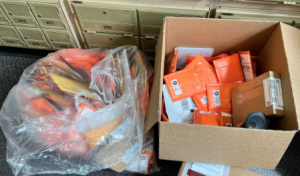 By 2024, when volunteers were invited to purchase and use their own AudioMoths, participation grew even bigger and the returns became more varied. Instead of neat, uniform envelopes, we began receiving packages of all shapes and sizes, many without an ES ID on the outside. Matching each one to online or handwritten notes added another layer of complexity and time.
Device prep behind the scenes
For the 2023 annular eclipse, we prepped and mailed 219 kits before the event (64 for ES partners and team, 155 free kits). These devices were shipped with batteries uninstalled, which meant participants had to set the device’s internal clock themselves. That turned out to be more complicated than expected and also revealed that some AudioMoths might malfunction.
 Between 2023 and 2024, we ran battery usage tests to see if we could set the clocks and install batteries before mailing and still have enough battery power left by eclipse day. The answer was yes. That change made things easier for volunteers in 2024, but it also added more work for the ES team. While we were still receiving and processing 2023 data, we were preparing and mailing 390 additional free kits for 2024. Each device had its time manually set before mailing, in addition to batteries installed.
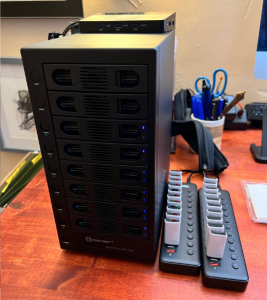
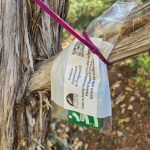
 One thing remained consistent in both years: every AudioMoth required a firmware update, which had to be performed one by one by connecting the device to a computer. We also logged each device’s serial number, manually assigned an ES ID, and labeled the device in both written and braille formats.
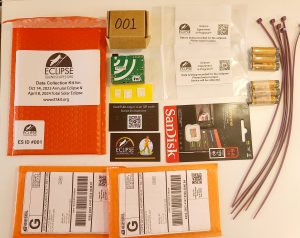
Beyond the devices themselves, we also provided everything a Data Collector might need, so it was as easy as possible to focus on the science of data collection. Each kit was assembled by hand with return labels, bags, and zip ties, and packaged one by one. This careful preparation was time-consuming but essential for keeping everything organized and supporting volunteers.
Two eclipses, back to back
It was incredibly exciting that the 2023 annular and 2024 total eclipses happened so close together. The 2023 eclipse gave us the chance to test our protocols for the first time, then immediately improve them for 2024. But it also meant the timelines overlapped. While we were still receiving and logging annular data, we were also reviewing what went well for Apprentices, Observers, and Data Collectors in 2023, updating trainings, preparing free kits, and making improvements for the total eclipse. The quick turnaround left us with some catching up to do once the 2024 data began arriving.
Training improvements took time

After the 2023 annular eclipse, we carefully reviewed what went right and what could be better across all three roles: Apprentice, Observer, and Data Collector. That review directly shaped some big changes for 2024. In addition to having complete instructions on the website, we added more live Q and A sessions, more live trainings, and quick tips that went out weekly in the days and weeks before the total eclipse. These changes helped Data Collectors feel supported and prepared (and also improved training for ES Observers), but the careful review and the work to build new materials also took time.
We began receiving cards in October 2023, with huge influxes in the two months after the 2023 annular eclipse and again after the 2024 total eclipse. The last wave arrived at the end of 2024, leaving us with a mountain of data ready to process.
What happens behind the scenes
 Processing was not just opening envelopes. It took custom computer programs written by the ES team to check every recording for a timestamp. If a device malfunctioned or was never set to the right time, we reviewed the Data Collector’s handwritten notes to determine the time and time zone. All times then had to be converted to UTC.
 We also had to calculate the exact eclipse times for each site, based on latitude and longitude. Some people entered this information online, others wrote it by hand, and some used formats that did not match the guidance we provided. That meant our team often converted locations by hand, corrected missing negatives in coordinates, and double checked any site that appeared in the middle of the ocean.
![]() To keep participants in the loop, we regularly updated a public “data dashboard” spreadsheet that showed what we had received for each site, including microSD cards, online notes, and written notes. Social media posts pointed people back to this dashboard so they could confirm their information. We also shared maps of sites and a feedback form where participants could flag errors or confirm details. Each case was resolved one by one, with as many fixes made as possible.
To keep participants in the loop, we regularly updated a public “data dashboard” spreadsheet that showed what we had received for each site, including microSD cards, online notes, and written notes. Social media posts pointed people back to this dashboard so they could confirm their information. We also shared maps of sites and a feedback form where participants could flag errors or confirm details. Each case was resolved one by one, with as many fixes made as possible.
![]() In total, five custom programs were developed to handle audio data, mapping, eclipse timing, and other tasks. All of this code, along with full documentation, will be released publicly on GitHub by the end of 2026.
In total, five custom programs were developed to handle audio data, mapping, eclipse timing, and other tasks. All of this code, along with full documentation, will be released publicly on GitHub by the end of 2026.
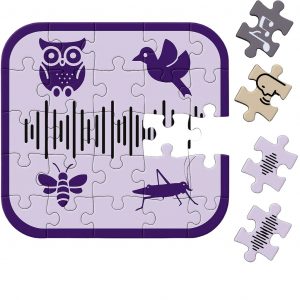 It was a bit like receiving thousands of puzzle pieces from hundreds of different puzzle boxes. Each piece matters, but first we had to sort them into the right box before we could put the bigger picture together.
Why your effort mattered
Even if your recording did not end up in the final published analysis, your participation still mattered. Every card, every note, and every attempt helped us refine the process and build one of the most extensive eclipse sound archives ever created, which is on track to be publicly available by the end of 2026. You helped prove that a project of this scale is possible.
Explore the full journey
Want to see exactly how data moves from envelopes on our desks to public access on Zenodo? Check out the Data Processing Stages section of the Your Data in Action page. There you will find the full flowchart and a plain language explanation of how we move data from collection to discovery.
👉 Your Data in Action: Processing Stages
How Artificial Intelligence Might Shape the Future of Eclipse Soundscapes Data
How Artificial Intelligence Might Shape the Future of Eclipse Soundscapes Data
By MaryKay Severino and Henry "Trae" Winter
 It’s hard to avoid hearing about how Artificial Intelligence (AI) is changing the way we live and work. Today, the word AI is used to describe many different kinds of computer programs that can learn and help machines solve tough problems, sometimes with human help and sometimes completely on their own. Organizations are working to keep up with the rapid changes in AI tools, best practices, and questions about ethics. Both researchers and managers are taking these changes seriously and are figuring out how to best use AI in NASA’s mission to share the exploration of the universe around us.
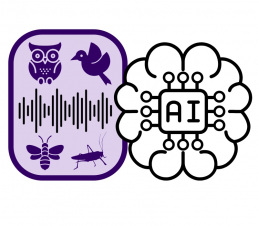
 Members of the Eclipse Soundscapes (ES) team recently attended a NASA open data repositories workshop that prompted us to consider how AI might impact the Eclipse Soundscapes Project, even as it comes to an end. AI is starting to influence many areas of research and data sharing. One way that AI might impact large datasets, like the 500+ ES audio datasets, is by helping future researchers find, process, and analyze large amounts of data more efficiently and effectively.
This raised an important question for us: How might these very near-future AI possibilities impact the way we share the audio data collected by ES Data Collectors during the 2023 Annular Eclipse and the 2024 Total Solar Eclipse? Here is what we learned and what we decided to do:
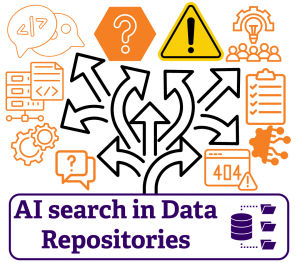
Preparing Data For AI Searches
 One topic of discussion was how projects can prepare data and metadata so they are searchable by AI, since this may be the way of the future.
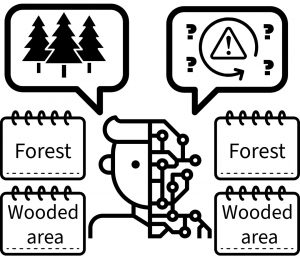
Right now, lots of metadata (information about the data) is language-based. That means additional information about the audio data, like site notes, habitat descriptions, or weather descriptions, might be recorded as words or phrases rather than numbers or standardized codes. While this works well for people reading the data, it makes it harder for AI to process consistently.
Language-based metadata examples from ES
- Site Location notes might say “near cattle pasture.”
- Habitat notes could say “forest,” “woods,” or “woodland.” These all mean the same thing to a person, but could be interpreted differently by AI.
Data Repositories and Preparing for AI
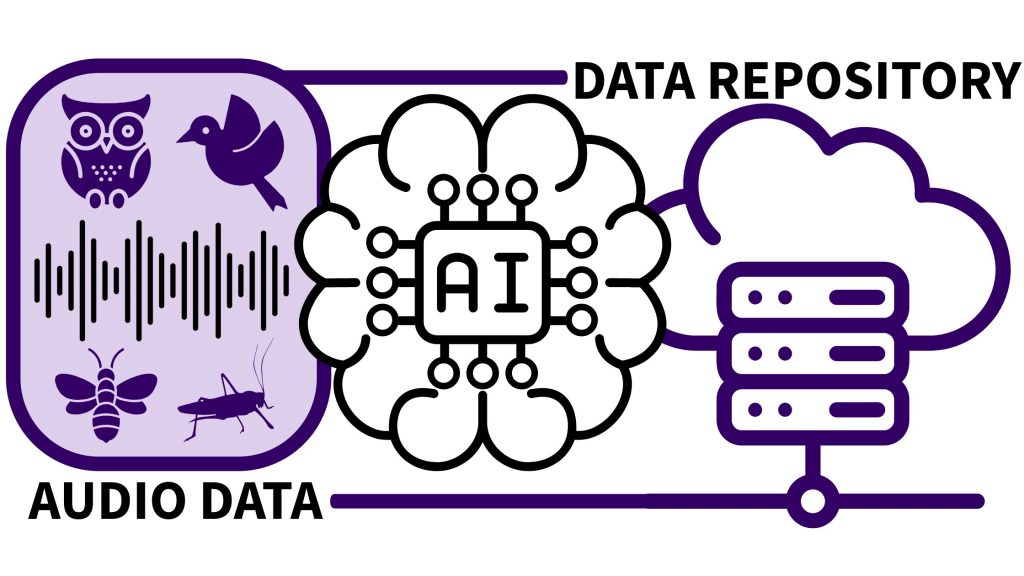
 A data repository is a platform where projects store their data so that it can be preserved and reused by others. If data repositories want improved AI search functionality in the future, they may eventually require that data be submitted in new AI search-ready formats.
- Zenodo, the platform ES uses to store and share its audio and observation data, is one example of a data repository.
- GitHub, the platform where ES shares its software and code, is another example of a data repository.
 Not all data repositories have decided on standards for AI search. GitHub has introduced AI tools such as Anthropic Claude Sonnet, ChatGPT, and Gemini 2.5 Pro for creating code, but has not yet included AI agents for finding already existing code. Zenodo has not yet incorporated AI tools into its repository, and adding such tools is not in its current development roadmap. With the AI search landscape changing so quickly, it is hard to predict how AI search tools will be implemented in data repositories and how data providers should format their data for AI.
Vector Databases: An AI Search-Friendly Format
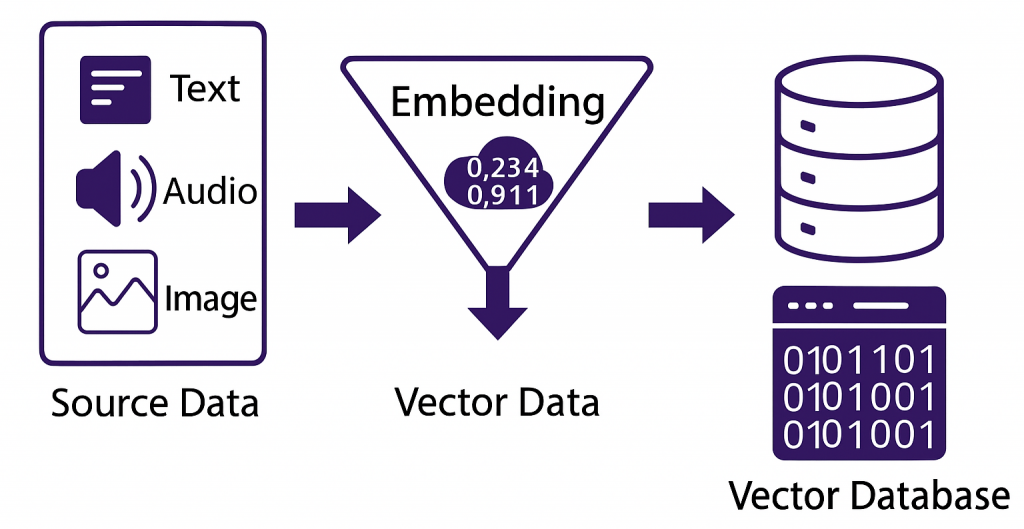 One AI search-friendly option that was discussed is putting each project’s data into a vector database that could be shared with its chosen data repository. A vector database combines data with metadata and also describes that metadata numerically rather than through language and keywords.
These numerical metadata descriptions make it easier for AI to:
- Recognize similarities rather than just exact search term matches
- Remember and connect previous inputs
- Understand data in a broader context
Examples of vector database platforms include:
- ChromaDB (Open Source, Python-based) https://github.com/chroma-core/chroma
- Pinecone (Commercial) https://www.pinecone.io/
Zenodo, the repository where ES data is being archived, does not currently have a plan to support vector databases. It is impossible to predict how Zenodo or other online data repositories might incorporate vector databases and what future standards they may require.
ES’s Decision
Creating a vector database is more than what Eclipse Soundscapes can take on right now. It would take more time and resources than the project has and would mean looking for new data repositories or doing extensive work to fit it into Zenodo’s framework.
Still, we’re glad we explored this possibility. Thinking about what AI might mean for scientific data is worthwhile, even if we can’t take it on ourselves. As projects wind down, it helps to keep looking ahead. Our team will carry this knowledge into future efforts, and by sharing it here, the ES community can carry it forward too.
If you want to learn more about vector databases, check out these articles:
- Microsoft’s article: Understanding Vector Databases
- Cloudflare’s article: What is a Vector Database?
Preliminary Results from the Eclipse Soundscapes Project
Preliminary Results from the Eclipse Soundscapes Project
by Kelsey Perrett and MaryKay Severino
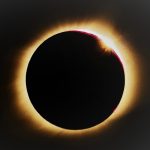
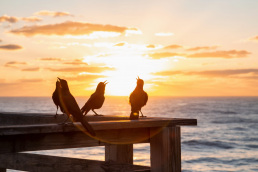
Do birds sing during a solar eclipse? One year after the Great American Eclipse of 2024, we’re learning how avian species responded to this inspiring celestial event.
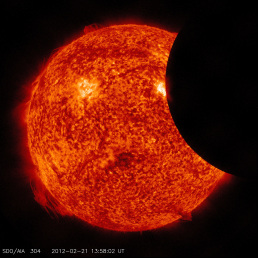
As one facet of the Eclipse Soundscapes Project, 1310 people began the process to be ES Data Collectors and almost 500 Data Collectors used AudioMoth recording devices to capture soundscapes before, during, and after the April 8, 2024 solar eclipse. The aim was to establish a baseline for “normal” soundscape activity on non-eclipse days and determine whether those soundscapes were altered by the total solar eclipse, in which the Moon passes in front of the Sun, temporarily blocking its rays. 45,960 total hours of audio were captured (if a human were to listen to the recordings for 8 hours a day, it would take 16 years to complete!) Over the past year, the Eclipse Soundscapes team has worked tirelessly to organize this gigantic collection of audio data. Now, with the help of wildlife biologist Dr. Brent Pease and the machine learning technology of BirdNET, Eclipse Soundscapes has uncovered some exciting patterns in the data that indicate how bird species reacted to the eclipse.
The map shows the locations where audio data for the 2024 Eclipse Soundscapes project was recorded and shared with the ES team. The map also illustrates the eclipse path. If the map does not load, or to open it in a separate tab, click here.
Historical accounts of bird vocalizations
Eclipse Soundscapes was based on an early participatory science initiative from the 1930s. For the August 31, 1932 total solar eclipse, the Boston Society of Natural History invited the general public to submit written observations of any animal behaviors they noticed during the eclipse. Many of these anecdotal reports suggested that animals — including birds — changed their vocal activity as the sky darkened. “It was noticeable that as the eclipse progressed, there was a decrease in the chorus, with a silence during totality,” wrote one participant. Other participants noted an increase in bird activity — the society received “several reports of hooting from wilder sections in New Hampshire.”

Establishing a baseline for bird vocalization
Interestingly, the preliminary findings from Dr. Pease and the team mirror the anecdotal reports presented by the Boston Society of Natural History. The Eclipse Soundscapes Project ran its 2024 audio data through BirdNET, a machine-learning tool that identifies bird species from sound recordings. Because Eclipse Soundscapes Data Collectors recorded for two days prior to the eclipse and for two days after the eclipse as baseline data, the researchers were able to estimate the probability of vocalization during a 4-minute window at the specific time of day when totality occurred. (Totality occurs when 100% of the Sun is blocked by the Moon). They then used that data to investigate the question of whether bird vocalization patterns change during a solar eclipse.
Do bird vocalization patterns change during an eclipse?
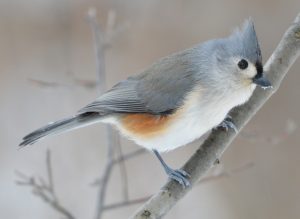
The initial data showed varied results. Some bird vocalizations increased during totality, while others decreased. However, when the researchers broke the vocalization down by species and by family, patterns began to emerge. Birds like the Tufted Titmouse showed a marked decline in vocalization during totality (a 5% decrease in the probability of vocalizing compared to the same 4-minute time period on non-eclipse days).
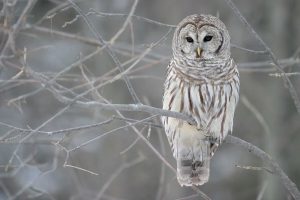
On the other hand, Barred Owls increased vocalization during totality (a 4% increase in vocalization probability).
Although researchers have audio data from the eclipse day, they used probability of vocalizing to compare that behavior to a typical day at the same time and location. This approach helps account for natural daily rhythms (some species are more or less active at certain times) and provides a clearer picture of how eclipse conditions altered usual behavior. A negative change means the species was less likely to vocalize during the eclipse than expected, while a positive change indicates an increase beyond typical levels.
The trends remain when looking at bird families. Ichteridae and Paridae (including titmice) consistently showed decreased vocalizations, while Corvidae and Strigidae (including owls) consistently showed increased vocalizations. This variation may be explained by species’ sensitivity to light. Nocturnal species and those that typically vocalize at dusk, such as robins, appeared to respond to the eclipse with increased vocal activity, suggesting a response to the sudden dimming of light or heightened sensitivity to light cues.
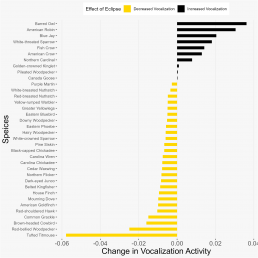
This bar graph shows how the probability of vocalization on solar eclipse day by bird species. It uses audio data collected during the week of the April 8, 2024 total solar eclipse. The graph lists bird species on the left side and shows whether each became more or less vocal during the eclipse. Yellow bars pointing to the left show birds that were quieter than usual, while black bars pointing to the right show birds that were more vocal. Birds that increased their vocalizations include the Barred Owl, American Robin, Blue Jay, White-throated Sparrow, Fish Crow, and American Crow. Birds that became quieter include the Tufted Titmouse, Red-bellied Woodpecker, Brown-headed Cowbird, Common Grackle, and Red-shouldered Hawk. The biggest decrease in vocal activity came from the Tufted Titmouse, while the Barred Owl showed the largest increase.
Timing of the behavioral response
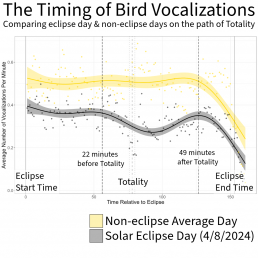
With these special and familial patterns in mind, the researchers could then explore the timing of the behavioral response: At which point before or during totality did vocalization changes start? And how long do those changes last? The team charted the average number of bird vocalizations per minute across time, for both a “random day” before/after the eclipse, and on the day of the eclipse. The graphs showed that decreased vocalization began trending downward about 22 minutes prior to totality, and returned to normal approximately 49 minutes after totality.
For all other periods on the day of the eclipse, vocalizations per minute roughly matched the trajectory of the random days. Recordings taken outside the path of totality also roughly matched the trajectory of the random days, and are not included in the graph below. This indicates that the changes in vocalizations per minute were unique to the path of totality on the day of the eclipse.
While these findings are currently more about gaining baseline knowledge, they raise interesting questions about how birds respond to sudden changes in light. Could similar patterns emerge during other abrupt natural events, like thunderstorms or wildfires? Understanding these responses might eventually help researchers distinguish between different types of environmental disruptions, offering new ways to monitor ecosystem health through sound.
What’s next?
“It’s still early stages,” Dr. Pease said about these preliminary results. “We’re starting to see some really interesting and fun things. But there are lots more questions and more analysis to do.” Dr. Brent Pease, a Soundscapes Subject Matter Expert, is leading research efforts to analyze eclipse-related audio data collected by ES volunteers. His work focuses on understanding how wildlife responds to eclipses through changes in natural soundscapes.
A few questions Dr. Pease would like to explore include:
- Proximity to totality: How close to totality do birds need to be to produce these changes? Location data tied to the audio recordings will help Eclipse Soundscapes answer this question.
- The “dawn chorus reprise:” Dr. Pease notes a slight bump in the graph after totality in which birds vocalization increased. A closer look at which birds are making these vocalizations will help researchers determine if it does in fact mimic dawn-like activity.
- Non-bird responses: Do other species (like insects) change their vocalizations during the eclipse?
- 2023 Annular Eclipse vs. 2024 Total Solar Eclipse – Soundscapes Audio Data: Does the bird response along the path of annularity during the 2023 annular eclipse (with approximately 90% coverage) match the response just outside the path of totality during the 2024 total solar eclipse, where coverage was also around 90%?
While researchers are only beginning to scratch the surface of these questions, the collected audio data for the project will be uploaded to the Eclipse Soundscapes Community on Zenodo, a free, open-access repository before the project ends. Present and future researchers will be able to access this audio data to learn more about how eclipses impact soundscapes on Earth and other questions. The Eclipse Soundscapes team looks forward to learning more about the data collected by our fantastic Eclipse Soundscapes volunteers!
To learn more about the preliminary results, watch or listen to Dr. Pease’s presentation “Eclipse Soundscapes: Partnering with the Public to Illuminate the Effect of Eclipses on Wildlife” or join us for a webinar. To learn what webinars are coming up, visit the ES Learning Community page.
References
Wheeler, William Morton . et al. “Observations on the Behavior of Animals during the Total Solar Eclipse of August 31, 1932.” (1935).
2023: Site ES ID #002
Annular Eclipse Data Site: ES ID#002
This Data Analysis site experienced a significant soundscape change on the day of the October 14, 2023, annular eclipse compared to non-eclipse days. To help identify the cause of this change, please listen to each of the three audio recordings below, each 2-3 minutes long. Make sure to listen to the full audio clip. After listening to each recording, complete a short survey about what you heard. Finally, once you’ve listened to all three clips, a final survey will capture your observations on the differences between the eclipse day and the two non-eclipse days. In total, there are three audio clips and four surveys. Completing all the steps to analyze each audio clip and do the final comparison survey should take about 10-15 minutes, and it helps to do all steps in one sitting.
At the end, if you are 18 years or older, you will have the option to include your name if you would like to receive credit as a NASA volunteer scientist if any of the submitted results support scientific research. This is optional; you may remain anonymous. Thank you for your valuable contributions!
ES ID# 002 Audio Analysis #1 of 3
ES ID# 002 Audio Analysis #1
Listen to the entire audio clip and then complete the survey below.
A Google form should load below. If it does not, or if you prefer to complete the survey in another window, click Open the Audio Analysis #1 Survey in another tab.
Site Information
Eclipse Soundscapes Identification Number (ES ID #): 002
Audio Clip Time Frame: 16:36:05 – 16:38:05 UTC
Type of Eclipse: Annular Eclipse
Eclipse Maximum (When the most possible amount of the Sun is blocked): 16:37:25 UTC
Eclipse Coverage (Maximum Percentage of the Sun blocked): 90%
Latitude: 35.689
Longitude: -105.88677
A Google form should load below. If it does not, or if you prefer to complete the survey in another window, click Open the Audio Analysis #2 Survey in another tab.
Site Information
Eclipse Soundscapes Identification Number (ES ID #): 002
Audio Clip Time Frame: 16:36:05 – 16:38:05 UTC
Type of Eclipse: Annular Eclipse
Eclipse Maximum (When the most possible amount of the Sun is blocked): 16:37:25 UTC
Eclipse Coverage (Maximum Percentage of the Sun blocked): 90%
Latitude: 35.689
Longitude: -105.88677
ES ID# 002 Audio Analysis #3 of 3
A Google form should load below. If it does not, or if you prefer to complete the survey in another window, click Open the Audio Analysis #3 Survey in another tab
Site Information
Eclipse Soundscapes Identification Number (ES ID #): 002
Audio Clip Time Frame: 16:36:05 – 16:38:05 UTC
Type of Eclipse: Annular Eclipse
Eclipse Maximum (When the most possible amount of the Sun is blocked): 16:37:25 UTC
Eclipse Coverage (Maximum Percentage of the Sun blocked): 90%
Latitude: 35.689
Longitude: -105.88677
A Google form should load below. If it does not, or if you prefer to complete the survey in another window, click Open the final Survey in another tab.
Volunteer Science: ES Observer Role
Volunteer Science:ES Observer Role
The lesson plans in the Observer Curriculum have been designed to help prepare students by equipping them with the scientific observation skills and vocabulary they will need to be Eclipse Soundscapes Observers. Now they are ready to participate as ES Observers. Below are two handouts to send home with your students to guide them in this activity:
 Click here to download Eclipse Soundscapes Project info & Participation Roles Info Flyer (PDF) This flier will provide parents/guardians with more information about the Eclipse Soundscapes Project. Credit: L.Fuller and ES Team for Eclipse Soundscapes with NASA support under award No. 80NSSC21M0008
To help take effective notes, we recommend using the Eclipse Soundscapes Field Notes handout on Eclipse day.
 Click here to download your own Field Notes paper (PDF) [English]
Click here to download your own Field Notes paper (PDF) [Spanish]
Click here to open the Field Notes paper as a Google Doc Copy [English]
Post Eclipse Day - Data Literacy Classroom Activity
We hope you will encourage your students to submit their observations online to the Eclipse Soundscapes Project as it it is very valuable to the science of the eclipse soundscapes project! And, anyone who submits their observations will receive a downloadable ES Observer certificate!
One way to support your students in submitting their observations to the Eclipse Soundscapes project while also helping them improve practical web-form related data literacy skills is to add a post-eclipse ES Observer activity!
You could have your students bring their eclipse observation notes to school after the eclipse. Together you and your students could discuss their observations! Then your students could utilize their notes to fill out the online observation submission web form! All ES Observers should submit their observations on the ES Observer page.
To preview what the online survey will look like, Click here to download ES Observer Role Survey Preview PDF.
ES Observers Under 13
ES Observers under 13 years old will not be asked for their name or email address. The latitude and longitude entry is optional for people under 13 and only allowed if completed with the guidance of an adult.
ACTIVITY FEEDBACK
We want to hear from you! If you used either of these activity ideas or any of these resources, please submit your feedback via a short survey!
Lesson Plan: Multi-sensory Observing
Lesson Plan:Multi-sensory Observing
Created in collaboration with Tracey Kline, Lynn Public Schools, Lynn, MA
Grades 6-8, CCSS.ELA-LITERACY.W.8.10
STANDARD
Common Core State Standards for English Language Arts & Literacy in History/Social Studies, Science, and Technical Subjects: CCSS.ELA-LITERACY.W.8.10 Write routinely over extended time frames (time for research, reflection, and revision) and shorter time frames (a single sitting or a day or two) for a range of discipline-specific tasks, purposes, and audiences.
LEARNING/ CONTENT/ LANGUAGE OBJECTIVE:
Students will be able to record observational science field notes in writing using multi-sensory observation skills.
LANGUAGE DEMAND:
Essential / Academic Vocabulary: observe/observation, multi-sensory, field journal + sensory vocabulary list
LESSON STRUCTURE
Lesson Beginning / Frame the Learning
(Clear entry routine, Do-Now, Activator, etc.; Frame the lesson by sharing and explaining lesson objective, agenda, and goals)
Differentiation
What supports and scaffolds am I providing based on the WIDA can-do descriptors?
![]() Do Now: Guess the Sound video. Have students write the numbers 1-20 in their notebook. As they watch the video, “Guess the Sound,” they should write down a, b, c, or d before it tells them the answer.
Do Now: Guess the Sound video. Have students write the numbers 1-20 in their notebook. As they watch the video, “Guess the Sound,” they should write down a, b, c, or d before it tells them the answer.
- Link to Video: https://www.youtube.com/watch?v=wVyQ_8-k8Co
- Video in lesson slides provided in Lesson Resources below
![]() Review the objectives with the students.
Review the objectives with the students.
![]() Do Now Word Bank & Sentence Starters
Do Now Word Bank & Sentence Starters
- Provide word bank and sentence starters for students who need it.
Resource: WIDA can-do descriptors
Lesson Middle
(I do- teacher directed; We do- practice with the teacher; You do- partner/small group application with teacher support)
* Revisit language objective and agenda; formative assessment- check for understanding (intervention and extension opportunities available)
Differentiation
What supports and scaffolds am I providing based on the WIDA can-do descriptors?
![]() I do: Watch video, “Field Journals.” Have students think about: What is a field journal? What are the four things to include in a field journal? Stop to explain as needed.
I do: Watch video, “Field Journals.” Have students think about: What is a field journal? What are the four things to include in a field journal? Stop to explain as needed.
- Link to video: https://youtu.be/93aMXg3GbdA
- Video in lesson slides provided in Lesson Resources below.
![]() We do: After the video, discuss students’ thoughts on: What is a field journal? What are the four things to include in a field journal?
We do: After the video, discuss students’ thoughts on: What is a field journal? What are the four things to include in a field journal?
![]() We do: Pass out the Sensory Vocabulary List. Allow students a few minutes to read over the list. Then have students underline all of the words they recognize. Then have students circle 5-10 more words they would like to practice using in their observations.
We do: Pass out the Sensory Vocabulary List. Allow students a few minutes to read over the list. Then have students underline all of the words they recognize. Then have students circle 5-10 more words they would like to practice using in their observations.
- Sensory vocabulary list provided in Lesson Resources below.
![]() I do: Pass out two copies of the observer journal to each student. Review the directions for the Observation journal activity.
I do: Pass out two copies of the observer journal to each student. Review the directions for the Observation journal activity.
Student Directions:
- We will go outside as a class and stand/sit in one area near each other.
- Complete the 1 Observer journal together.
- Practice sharing observations for each of the categories using the Sensory Vocabulary List.
- Write notes
- Make 1-2 drawings in two categories of your choice.
- Then you will complete the 2nd Observer journal by yourself.
- Observer Journal Handout provide in Lesson Resources below.
![]() We do: As a class, fill out the top information on one of the observer journals. Then head outside to complete.
We do: As a class, fill out the top information on one of the observer journals. Then head outside to complete.
- Resource Link: Google Maps to find latitude and longitude: https://eclipsesoundscapes.org/location-reporting-format/
![]() We do: Go outside as a class and stand/sit in one area near each other. Practice an observation using the observer journal all together. Have students share their observations regarding each of the categories. Encourage students to use the Sensory Vocabulary List. After several notes have been taken per category, have students make two drawings in two categories.
We do: Go outside as a class and stand/sit in one area near each other. Practice an observation using the observer journal all together. Have students share their observations regarding each of the categories. Encourage students to use the Sensory Vocabulary List. After several notes have been taken per category, have students make two drawings in two categories.
![]() Reduce Vocabulary List Load:
Reduce Vocabulary List Load:
Highlight specific words on the Sensory Vocabulary handout for students who may need extra support. By highlighting a smaller set of words, it allows students to focus their attention.
- Consider focusing on words that might already be in their vocabulary and cognates of their native language.
Resource: WIDA can-do descriptors
Lesson End
(You do- independent application; Summarize learning; Clear exit routine)
* Formative assessment-exit ticket, check for understanding, etc.
![]() You do: While still outside, have students individually complete a second observer journal. Students can use the Sensory Vocabulary List.
You do: While still outside, have students individually complete a second observer journal. Students can use the Sensory Vocabulary List.
FORMATIVE ASSESSMENT
How am I measuring success? (Connection to your Content/ Language objective)
The teacher can measure student success by collecting field journal graphic organizers.
LESSON RESOURCES
- LINK TO Multi-sensory Observing LESSON PLAN (Google Doc): When you open this link you will be prompted to make a copy of the Google document. This will allow you to download, print, and/or edit the above lesson plan to best meet your needs.
- LINK TO Multi-sensory Observing SLIDES (Google Slides): When you open this link you will be prompted to make a copy of the Google slides. This will allow you to edit either of these slide options to best meet the needs of your classroom.
- LINK TO Sensory Vocabulary HANDOUT (Google Doc): When you open this link you will be prompted to make a copy of the Google document. This will allow you to download, print, and/edit the Google document to best meet the needs of your classroom.
- LINK TO Observer Field Journal HANDOUT (Google Doc): When you open this link you will be prompted to make a copy of the Google document. This will allow you to download, print, and/edit the Google document to best meet the needs of your classroom.
LESSON FEEDBACK
We want to hear from you! If you used this lesson plan or any of these resources, please submit lesson plan feedback via a short survey!
Lesson Plan: Nature during a Solar Eclipse
Lesson Plan:Nature During a Solar Eclipse
Created in collaboration with Tracey Kline, Lynn Public Schools, Lynn, MA
Grades 6-8, NGSS: MS-ESS1-1 Earth’s Place in the Universe
NGSS STANDARD
MS-ESS1-1: Develop and use a model of the Earth-Sun-Moon system to describe the cyclic patterns of lunar phases, eclipses of the sun and moon, and seasons. (Clarification Statement: Examples of models can be physical, graphical, or conceptual.)
LEARNING/ CONTENT/ LANGUAGE OBJECTIVE:
Predict
Students will be able to predict the sounds and sights in their location during the solar eclipse.
LANGUAGE DEMAND:
Essential / Academic Vocabulary: diurnal, nocturnal, camouflage
LESSON STRUCTURE
Lesson Beginning / Frame the Learning
(Clear entry routine, Do-Now, Activator, etc.; Frame the lesson by sharing and explaining lesson objective, agenda, and goals)
Differentiation
What supports and scaffolds am I providing based on the WIDA can-do descriptors?
![]() Do Now: “Multi-Sensory Eclipse Observations” Watch the two linked videos and answer the following questions.
Do Now: “Multi-Sensory Eclipse Observations” Watch the two linked videos and answer the following questions.
- How would you observe animals or your environment during a solar eclipse using all of your senses?
- What would you listen for?
- What would you look for?
- What would you try to feel/touch?
- Recording the information you gather during your observations is important. How or where would you record your information during scientific investigation?
- Click Multi-sensory Eclipse Observations Do Now for videos.
- Lesson Slides provided in Lesson Resources below.
![]() Review the objectives with the students.
Review the objectives with the students.
![]() Do Now:
Do Now:
- Provide word bank and sentence starters for students who need it.
I would listen for …
I would look for…
I would try to feel/touch…
Reference: WIDA can-do descriptors
Lesson Middle
(I do- teacher directed; We do- practice with the teacher; You do- partner/small group application with teacher support)
Differentiation
What supports and scaffolds am I providing based on the WIDA can-do descriptors?
* Revisit language objective and agenda; formative assessment- check for understanding (intervention and extension opportunities available)
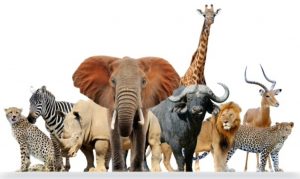
![]() I Do: Review the Do Now in detail going over what happens during an eclipse with the animals and why. Discuss the answers to the questions, what the students learned, and what animals and insects were in the video. (slide 2)
I Do: Review the Do Now in detail going over what happens during an eclipse with the animals and why. Discuss the answers to the questions, what the students learned, and what animals and insects were in the video. (slide 2)
![]() We Do: Thinking about the Do Now videos, brainstorm together how the behavior of the animals changed before, during, after the eclipse on the board. (slide 3)
We Do: Thinking about the Do Now videos, brainstorm together how the behavior of the animals changed before, during, after the eclipse on the board. (slide 3)
![]() We Do: Using the Graphic Organizer Handout, Brainstorm with the students the “insects” they know live in the area in which they will be experiencing the eclipse and add which of those they might be able to hear or see. (slide 4)
We Do: Using the Graphic Organizer Handout, Brainstorm with the students the “insects” they know live in the area in which they will be experiencing the eclipse and add which of those they might be able to hear or see. (slide 4)
- Graphic Organizer provided in Lesson Resources below.
![]() You Do (Pairs/Groups): Have students spend 5 minutes with a partner brainstorming and filling out the rest of the graphic organizer. After 5 minutes, have students meet with another pair to talk about their ideas and add more to their brainstorm worksheet. (slide 5)
You Do (Pairs/Groups): Have students spend 5 minutes with a partner brainstorming and filling out the rest of the graphic organizer. After 5 minutes, have students meet with another pair to talk about their ideas and add more to their brainstorm worksheet. (slide 5)
![]() I Do: Teacher explains the “research and predict” project directions. Handout with directions in Lesson Resources below. (slide 6)
I Do: Teacher explains the “research and predict” project directions. Handout with directions in Lesson Resources below. (slide 6)
- Research & Predict Handout provided in Lesson Resources below.
![]() We Do: Research the 1st animal and answer animal and prediction questions together as a class with the teacher eliciting what to write from the students and modeling how to write answers. Students should also fill-in on their papers. Use iNaturalist map search directions on handout to model how to search. (slide 7)
We Do: Research the 1st animal and answer animal and prediction questions together as a class with the teacher eliciting what to write from the students and modeling how to write answers. Students should also fill-in on their papers. Use iNaturalist map search directions on handout to model how to search. (slide 7)
![]() Your Do (pairs): With partners, have students complete the research & predict handout by researching and writing about 3 more animals iNaturalist . (slide 8)
Your Do (pairs): With partners, have students complete the research & predict handout by researching and writing about 3 more animals iNaturalist . (slide 8)
![]() Pairing strategy
Pairing strategy
- Partner earlier proficient ELs with later proficient ELs or native English speakers.
![]() Graphic Organizer Modification
Graphic Organizer Modification
- have students draw a picture of each animal and plant and label/list what they see.
![]() Research Handout Modification
Research Handout Modification
- Provide Sentence Starters
- The ___ has ___ ___ , ___ ___, and ___ ___.
- It sounds like a ______ .
Yes, it surprised me. OR No, it didn’t surprise me. - I think it would be easy to see a ___ because _______________ OR I don’t think it would be easy to see a ___ because _____________________ . I think it would be easy to hear a ___ because __________ OR I don’t think it would be easy to hear a ___ because __________ .
- During the eclipse I think a ___ might __________ .
Reference: WIDA can-do descriptors
Lesson End
(You do- independent application; Summarize learning; Clear exit routine)
Differentiation
What supports and scaffolds am I providing based on the WIDA can-do descriptors?
* Formative assessment-exit ticket, check for understanding, etc.
![]() You Do (Exit Ticket): Have students write a prediction of which animals they think will change their behavior during the eclipse and why.
You Do (Exit Ticket): Have students write a prediction of which animals they think will change their behavior during the eclipse and why.
![]() Exit Ticket Modification
Exit Ticket Modification
- Provide Sentence Starter
I think a ___ will _______ because _______ .
Reference: WIDA can-do descriptors
FORMATIVE ASSESSMENT
How am I measuring success? (Connection to your Content/ Language objective)
- Teacher can measure student success by checking students’ research handouts for accurate information.
- Teacher can measure student success by looking over students’ predictions and checking for predictions that are possible.
LESSON RESOURCES
- Nature During a Solar Eclipse LESSON PLAN (Google Doc): When you open this link you will be prompted to make a copy of the Google document. This will allow you to download, print, and/or edit the above lesson plan to best meet your needs.
- Nature During a Solar Eclipse SLIDES (Google Slides): When you open this link you will be prompted to make a copy of the Google slides. This will allow you to use and edit the lesson slides to best meet the needs of your classroom.
- Nature During a Solar Eclipse Brainstorm Notes Graphic Organizer HANDOUT (Google Doc): When you open this link you will be prompted to make a copy of the Google document. This will allow you to download, print, and/edit the Google document to best meet the needs of your classroom.
- Nature During a Solar Eclipse Research & Predict Activity HANDOUT (Google Doc): When you open this link you will be prompted to make a copy of the Google document. This will allow you to download, print, and/edit the Google document to best meet the needs of your classroom.
LESSON FEEDBACK
We want to hear from you! If you used this lesson plan or any of these resources, please submit lesson plan feedback via a short survey!
Lesson Plan: TEMPLATE
Lesson Plan:What is a solar eclipse?
Created in collaboration with Tracey Kline, Lynn Public Schools, Lynn, MA
Grades 6-8, NGSS: MS-ESS1-1 Earth’s Place in the Universe
NGSS STANDARD
LEARNING/ CONTENT/ LANGUAGE OBJECTIVE:
LANGUAGE DEMAND:
Essential / Academic Vocabulary:
LESSON STRUCTURE
Lesson Beginning / Frame the Learning
(Clear entry routine, Do-Now, Activator, etc.; Frame the lesson by sharing and explaining lesson objective, agenda, and goals)
Differentiation
What supports and scaffolds am I providing based on the WIDA can-do descriptors?
![]() Do Now:
Do Now:
![]() Review the objectives with the students.
Review the objectives with the students.
![]() Do Now Word Bank & Sentence Starters
Do Now Word Bank & Sentence Starters
- Provide word bank and sentence starters for students who need it.
Resource: WIDA can-do descriptors
Lesson Middle
(I do- teacher directed; We do- practice with the teacher; You do- partner/small group application with teacher support)
* Revisit language objective and agenda; formative assessment- check for understanding (intervention and extension opportunities available)
Differentiation
What supports and scaffolds am I providing based on the WIDA can-do descriptors?
![]() I do:
I do:
![]() We do:
We do:
![]() You do (Pairs):
You do (Pairs):
![]()
Pairing strategy: Partner earlier proficient ELs with later proficient ELs or native English speakers.
![]()
Resource: WIDA can-do descriptors
Lesson End
(You do- independent application; Summarize learning; Clear exit routine)
* Formative assessment-exit ticket, check for understanding, etc.
Differentiation
What supports and scaffolds am I providing based on the WIDA can-do descriptors?
![]() You do:
You do:
![]()
FORMATIVE ASSESSMENT
How am I measuring success? (Connection to your Content/ Language objective)
LESSON RESOURCES
- LINK TO LESSON PLAN (Google Doc): When you open this link you will be prompted to make a copy of the Google document. This will allow you to download, print, and/or edit the above lesson plan to best meet your needs.
- LINK TO SLIDES (Google Slides): When you open this link you will be prompted to make a copy of the Google slides. This will allow you to edit either of these slide options to best meet the needs of your classroom.
- LINK TO HANDOUT (Google Doc): When you open this link you will be prompted to make a copy of the Google document. This will allow you to download, print, and/edit the Google document to best meet the needs of your classroom.
Lesson Plan: What is a Solar Eclipse
Lesson Plan:What is a solar eclipse?
Created in collaboration with Tracey Kline, Lynn Public Schools, Lynn, MA
Grades 6-8, NGSS: MS-ESS1-1 Earth’s Place in the Universe
NGSS STANDARD
MS-ESS1-1: Develop and use a model of the Earth-Sun-Moon system to describe the cyclic patterns of lunar phases, eclipses of the sun and moon, and seasons. (Clarification Statement: Examples of models can be physical, graphical, or conceptual.)
LEARNING/ CONTENT/ LANGUAGE OBJECTIVE:
Students will be able to describe what a solar eclipse is in writing using a diagram.
LANGUAGE DEMAND:
Essential / Academic Vocabulary: solar eclipse, cosmic chance, orbit, shadow
LESSON STRUCTURE
Beginning / Frame the Learning
Middle
End
(clear entry routine, Do-Now, Activator, etc.; frame the lesson by sharing and explaining lesson objective, agenda, and goals)
(I do- teacher directed; we do- practice with the teacher; you do- partner/small group application with teacher support)
(you do- independent application; summarize learning; clear exit routine)
![]() Do Now: Notice and Wonder:
Do Now: Notice and Wonder:
Look at the diagram and write down 3-5 sentences and/or questions.
- Teacher will provide a diagram of a solar eclipse without it being labeled a solar eclipse.
- Have students share some of their thoughts on the diagram with the whole class and write them down on chart paper.
- Diagram provided in Lesson Resources below.
![]() Review the objective with students.
Review the objective with students.
* Revisit language objective and agenda; formative assessment- check for understanding (intervention and extension opportunities available)
![]() I do:
I do:
- Teacher shows a 1 minute video clip to students that describes what a solar eclipse is and why they occur. Teacher should stop and explain when needed throughout the video.
- Read text with the whole class. Teacher should stop and explain when needed.
- Video clip and text provided in Lesson Resources below.
![]() You do (pairs):
You do (pairs):
- In pairs, students will complete two-column notes using the reading. They work together, but must each write the notes so they each have a copy.
- Two Column Notes provided in Lesson Resources below.
- Teacher should collect the reading from the students before the “You do” activity. The students should keep their notes.
* Formative assessment-exit ticket, check for understanding, etc.
![]() You do:
You do:
- Individually, students will use their notes to create two diagrams and write about each diagram. One diagram will show the alignment of the Sun, Moon, and Earth during a solar eclipse. The second diagram will show the Moon’s orbit around Earth misaligned so that a solar eclipse does not occur. Students will write 2-3 sentences explaining each diagram. Student Directions: 1. Draw a diagram of a solar eclipse. Label the Sun, Earth, and Moon. Write 2-3 sentences explaining why solar eclipses happen. 2. Draw a diagram of the Moon’s orbit around the Earth. Write 2-3 sentences explaining why there is not a solar eclipse every month.
DIFFERENTIATION
What supports and scaffolds am I providing based on the WIDA can-do descriptors?
![]() DO NOW Word Bank/Sentence Starters:
DO NOW Word Bank/Sentence Starters:
- Provide word bank and sentence starters for students who need it.
I notice …
I wonder…
![]() Two Column Notes Modifications:
Two Column Notes Modifications:
- Provide cloze/fill-in-the-blank notes for students who need support finding information.
- Adapt the provided Cloze Two Column notes HANDOUT by adding numbers next to each topic and then write these numbers on the student’s text next to the paragraphs in which they can find the topic and its details.
- Two Column Cloze Notes provided in Lesson Resources below.
![]() Diagram & Writing Modifications:
Diagram & Writing Modifications:
- Provide diagrams without labels.
- Provide sentence starters.
Diagram 1 shows ______.
Solar eclipses happen because ________ .
FORMATIVE ASSESSMENT
How am I measuring success? (Connection to your Content/ Language objective)
Teacher can measure student success based on the diagrams and writing.
LESSON RESOURCES
- What is a solar eclipse? LESSON PLAN (Google Doc): When you open this link you will be prompted to make a copy of the Google document. This will allow you to download, print, and/or edit the above lesson plan to best meet your needs.
- What is a solar eclipse? LESSON SLIDES (Google Slides): When you open this link you will be prompted to make a copy of the Google slides. This will allow you to edit either of these slide options to best meet the needs of your classroom.
- Video Clip, START – 00:57, from Solar Eclipse 101 | National Geographic – Video clip is also embedded in Lesson slides. Entire video is not recommended for this lesson.
- Do Now “What is a solar eclipse” HANDOUT (Google Doc): When you open this link you will be prompted to make a copy of the Google document. This will allow you to download, print, and/edit the Google document to best meet the needs of your classroom.
- Text/Reading “What is a solar eclipse” HANDOUT (Google Doc): When you open this link you will be prompted to make a copy of the Google document. This will allow you to download, print, and/edit the Google document to best meet the needs of your classroom.
- Two Column Notes for “What is a solar eclipse” HANDOUT (Google Doc): When you open this link you will be prompted to make a copy of the Google document. This will allow you to download, print, and/edit the Google document to best meet the needs of your classroom.
- Two Column CLOZE Notes for “What is a solar eclipse” HANDOUT (Google Doc): When you open this link you will be prompted to make a copy of the Google document. This will allow you to download, print, and/edit the Google document to best meet the needs of your classroom.
LESSON FEEDBACK
We want to hear from you! If you used this lesson plan or any of these resources, please submit lesson plan feedback via a very short form! It should take less than 5 minutes!